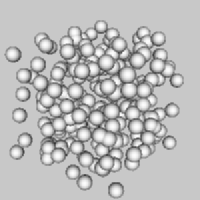
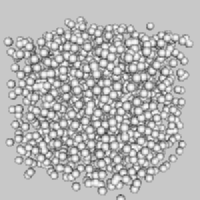
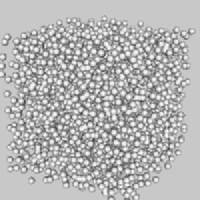
Comparison of different voxel traversal techniques
A performance comparison of various algorithms from the data published by
their authors is impossible, since different test scenes as well as
hardware platforms
and operating systems were usually used for their implementation.
Therefore a computer
experiment was set up, based on the rendering of phantom scenes with
randomly positioned spheres of various size and number.
- 3 classes of algorithms compared:
- Single voxel traversal -
Cleary and Wyvill (FRT)
- Hierarchical scene traversal -
Spackman and Willis (SMART)
- CD traversal (representing distance approaches)
- Test data
- Results:
If we render two scenes with an equal number of occupied voxels, but with
different distribution in space, a surface is usually found earlier in
the more complex one.
This tendency is illustrated in Figure 2, where dependency of the
background traversal time on the scene complexity is shown.
The shorter total traversed distance reduces render time, as can be
clearly observed on the FRT time, since this is not influenced by a variable
traversal step.
Both the CD and the SMART curves are the result of two contradictory
tendencies: smaller steps tend
to increase the traversal time, while the shorter traversed distance
decreases it.
The first tendency prevails on the left side of the graph, where the time
increases with increasing scene complexity, while the second tendency
prevails on the opposite side.
The longer traversal times for the SMART algorithm in
comparison to that obtained for the CD algorithm are
caused by geometric properties of the oct-tree structure
(CD macro regions adapt better to the object shape than
the oct-tree) and
by complex oct-tree traversal algorithm.
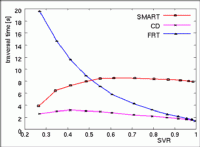
Figure 2:
Dependency of the background traversal time on scene complexity.
On the basis of this experiment we see that the distance based algorithms
can significantly speed up the background traversal phase of rendering by
ray tracing.
For a simple scene, the speed up can reach values around 10 in comparison
to the FRT.
Although this ratio decreases with growing scene complexity, the CD
algorithm is faster than FRT even for such complex scenes, as e.g., that
in Figure 1 with 1331 simulated objects.
The choice of the background traversal algorithm can influence the
hit-miss test and ray-surface intersection computation.
From this point of view, we compared two ways of the continuous line
definition, based on
- nonuniform samples, lying on faces of pierced voxels (represented by
the CD algorithm) and
- equidistant samples along the ray (represented by the 3D DDA).
For comparison purposes, a scene with a voxelized sphere was generated
and rendered with such parameters that all rays hit the surface.
- Comparison of two approaches from the point of view of
efficiency of hit-miss
test and surface detection.
Compared:
- Evaluation of the interpolating function:
- DDA ray generators:
-
- Samples within the voxel volume
- Hit-miss test: tri(linear) interpolation
- Surface detection: several voxels involved, bisection
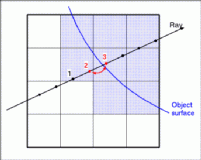
Figure 3: Detection of ray-surface intersection point in the case of the DDA
algorithm.
- CD ray generator:
-
- Samples on voxel faces
- Hit-miss test: bi(linear) interpolation
- Surface detection: volume of a single voxel, derivative based techniques
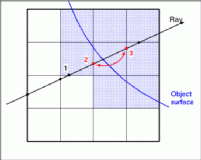
Figure 4: Detection of ray-surface intersection point in the case of the CD
algorithm.
- Results
Results of this experiment are summarized in
Figure 5.
The rendering times are expressed with respect to the best result
reached.
The background traversal, although with 3D complexity,
represents the shortest time interval since
much more time is spent for the hit-miss test and the surface position
detection.
The bisect surface detection is slower for the 3D DDA than for the CD
(more voxels involved), which is further slower than newt surface
detection (derivatives).
The 3D DDA hit-miss test also needs more time, due to more samples and
trilinear interpolations.
We can see that the approach with uniform ray sampling needs nearly 3 times
more time than that with samples on voxel faces.
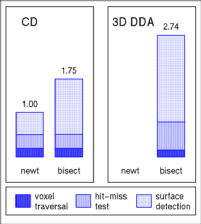
Figure 5: Background traversal and surface detection
comparison results.
(Full list of publications)
- Milos Sramek.
Visualization of Volumetric Data by Ray Tracing
ISBN 3-85403-112-2, 130 pages, Austrian Computer Society, Austria 1998
(download).
- Ivan Bajla and Milos Sramek. Nonlinear Filtering
and Fast Ray
Tracing of 3-D Image Data IEEE Engineering in Medicine and Biology Magazine,
2(17):73-80, 1997.
- Milos Sramek. A comparison of some ray generators for volume
graphics. In Václav Skala, editor, The Third International Conference
in Central Europe on Computer Graphics and Visualization 95, pages
466-475, University of West Bohemia, Plzen, Czech Republic, February 14
- 18, 1995.
-
Milos Sramek. Fast surface rendering from raster data by voxel
traversal using chessboard distance. In R. Daniel Bergeron and Arie E.
Kaufman, editors, Visualization'94, pages 188-195, Washington,
D.C., October 17-21, 1994. IEEE Computer Society Press.
-
John Spackman and Philip Willis.
The SMART navigation of a ray through an oct-tree.
Computers& Graphics, 15(2):185-194, 1991.
-
John C. Cleary and Geoff Wyvill.
Analysis of an algorithm for fast ray tracing using uniform space subdivision.
The Visual Computer, 4(2):65-83, July 1988.
-
Karel J. Zuiderveld, Anton H. J. Koning, and Max A. Viergever.
Acceleration of ray-casting using 3D distance transforms.
In R. A. Robb, editor, Visualization in Biomedical Computing II,
Proc. SPIE 1808, pages 324-335, Chapel Hill, NC, 1992.
-
Daniel Cohen and Zvi Sheffer.
Proximity clouds - an acceleration technique for 3D grid traversal.
The Visual Computer, 10(11):27-38, November 1994.
