The basic idea of the region-based approach is that classification of approximately homogeneous regions is less sensitive to superimposed noise than pixel-based classification, due to averaging of the properties over the region's area. The next advantage of the approach is that it enables to introduce scale into processing. Usually, large data sets are processed at larger scale levels, i.e. with suppression of small details, which enables us to concentrate to features relevant to the processed area, not being disturbed by the details. Introduction of scale into the problem thus significantly reduces computation cost by reducing number of processed primitives.
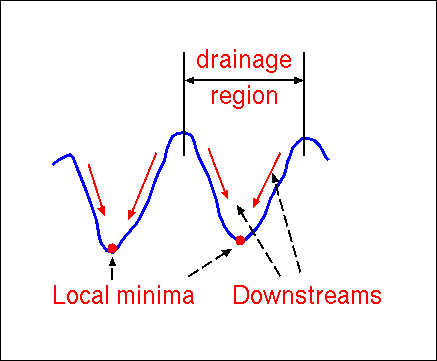
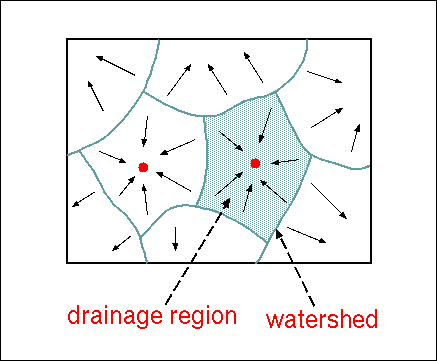
One possibility how to extract edges and regions from digital images, attracting interest of the vision community in the recent years, is the concept of watersheds, adopted from topography. From the point of view of this concept, gray scale images are considered as topographic reliefs. Around each local minimum M of such image a catchment basin C(M)s is defined, such that each of its points can be connected with the minimum M by a descending path, called downstream. Lines, separating different catchment basins are called watersheds.
| |
|
|---|---|
| (a) | (b) |
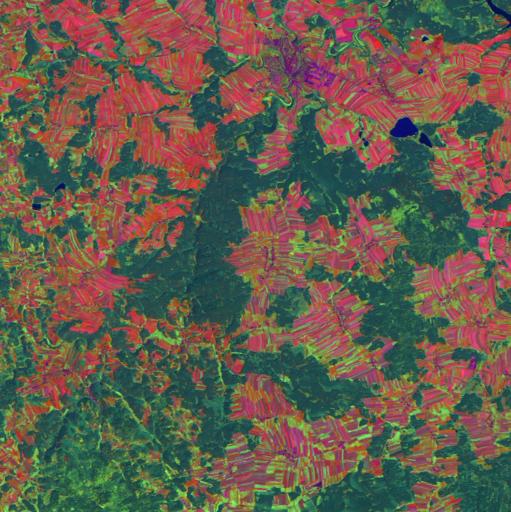
Step 1: The original data set.
Figure shows a pseudocolor satellite view of a landscape created from the
original 7 band Landsat TM data by principal component analysis - PCA
(thermal channel 6 was excluded). PCA band 1 is assigned to red,
PCA 2 to blue and PCA 3 to green band.
Green - forests, red - fields, light green and yellow - meadows,
violet - urban areas, blue - water.
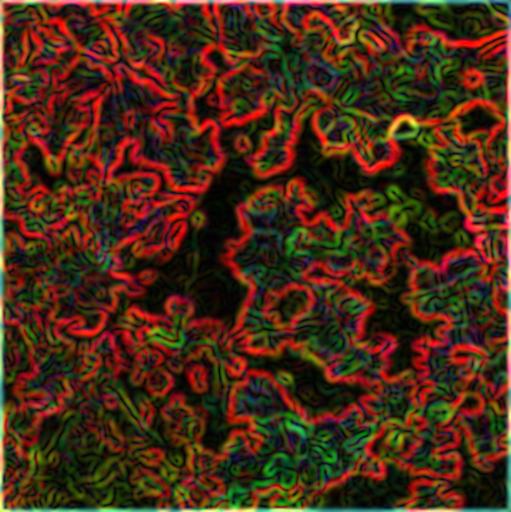
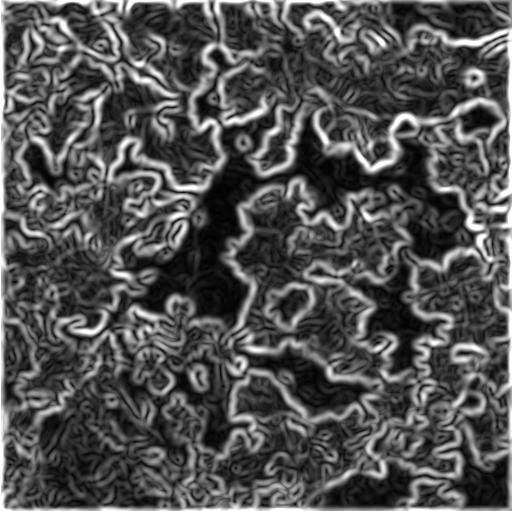
Step 2: Gabor filtering.
Figure shows result of filtering by the Gabor filter magnitude operator.
The Gabor filter is derivative of the Gaussian smoothing filter.
Thus, in one step, we smooth the image and compute magnitude of its gradient.
In this case, sigma=3 of the filter was used.
Step 3: Gradient amplitude maximum of all image bands.
The next step is conversion of the n band image to one band, by registering the
maximum gradient value of all bands.

Step 4: Detection and labeling of local minima of the gradient
maximum image.

Step 5: Region detection by the steepest descend technique.
Regions, detected in the Gradient amplitude image.
The unique labels of the local minima are assigned to all pixels of the
region by a back propagation technique.
Step 6: Region contours - watersheds.
Watersheds - region contours - overlayed over the original image.
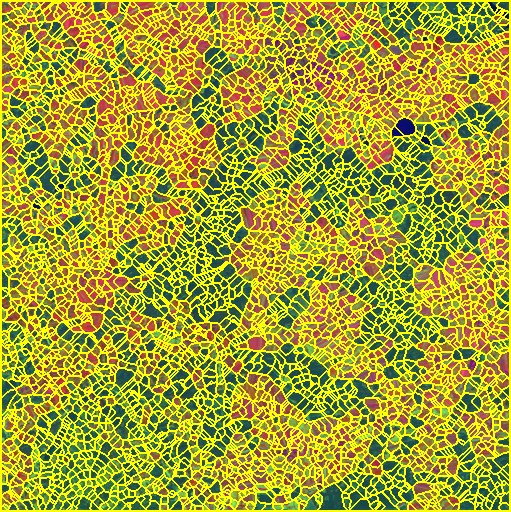
Smoothing by the Gaussian filter results in desired larger regions. However, also region contours are affected: they are smoother and do not follow edges exactly.
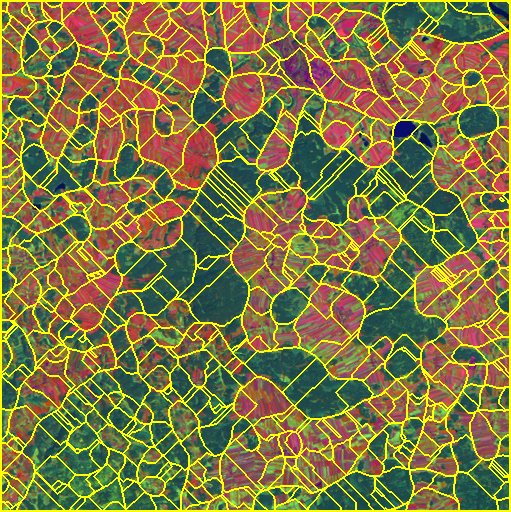
Figure 2: Imprecise region contours after smoothing with a sigma=9 Gaussian.
To avoid this drawback, we proposed a technique, based on watershed hierarchies, i.e. on a sequence of regions obtained by smoothing the image by different Gaussians with increasing sigma. Images with small sigma have precise contours but small mean region size, while images with large sigma value have larger regions with imprecise contours. The idea of the hierarchical watershed segmentation is to transfer the (precise) contours from low levels to the large regions at the higher levels of the hierarchy by means of region overlapping. Thus we get regions with size corresponding to the highest smoothing level and with contour precision corresponding to the lowest smoothing level.
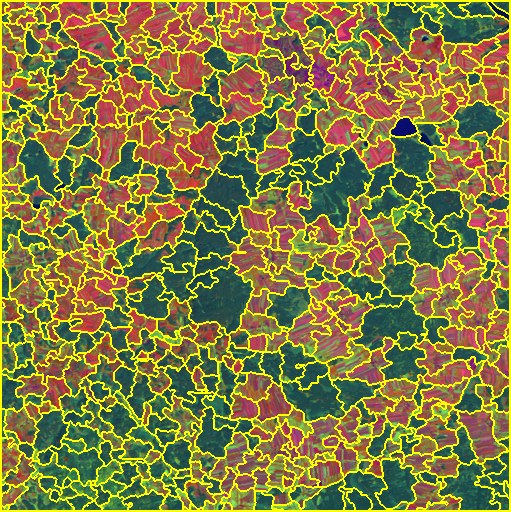
Figure 3: Precise region contours after smoothing with a sigma=9 Gaussian, using the hierarchy approach.
Regions, obtained by the watershed segmentation technique can be used as a starting platform for different region-based segmentation and classification techniques.
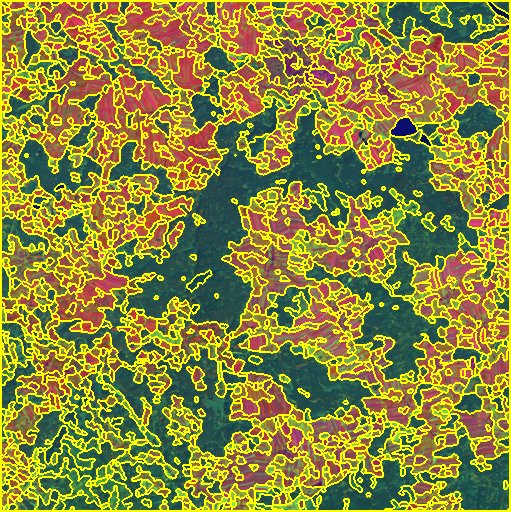
Figure 4: Merging of regions, obtained by the watershed technique. Spectral distance between the mean density values within a region for each band was used as the similarity criterion.
The proposed segmentation procedure was implemented as a part of Landsat-TM image segmentation and classification package ImagineWS, in the frame of the Structural Features of Landscape Ecology as Indicators for Sustainable Land Use project at Institute of Information Processing, Vienna, Austria. It is based both on the XITE image processing package and the ERDAS IMAGINE image processing and GIS package. ImagineWS consists of the following components:
(Full list of publications)
|
Back to Milos Sramek's home page |
|